1. Introduction to Hyperspectral Imaging
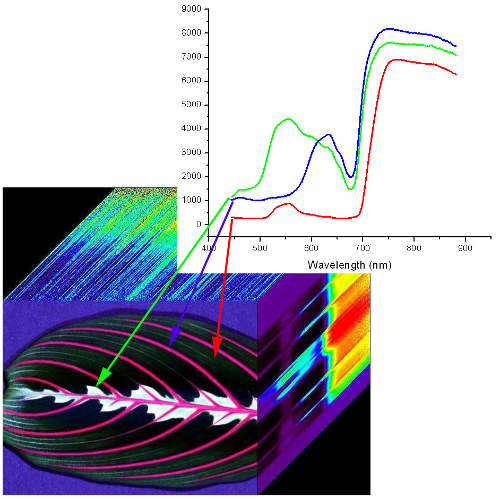
Hyperspectral Imaging, or imaging spectroscopy, refers to the creation of a digital image containing very high spectral (color) resolution. Each spatial point (pixel) in a hyperspectral image represents a continuous curve of incoming light intensity versus wavelength. For example, red, green, and blue arrows below show the spectra for three pixels of an image of a leaf in the image below. The data can also be interpreted as a stack of images, with each layer in the stack representing the scene at a different wavelength – this “stack” of two-dimensional images is referred to as a “datacube.”
The benefit of the additional information provided by hyperspectral imaging is that it generally allows you to tell the difference between materials better than you can with traditional color images. This capability can be applied to a wide range of current and emerging applications in remote sensing, sorting, quality control, research and development, and more.
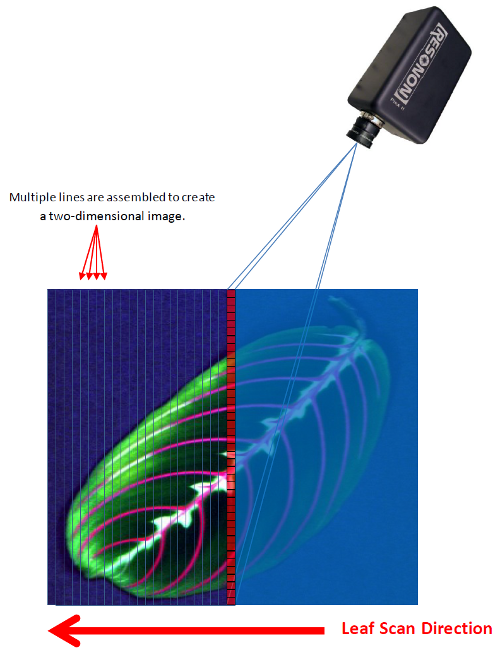
Resonon imaging spectrometers are line-scan imagers, which means they collect data one line at a time. To assemble a complete two-dimensional image, multiple lines are imaged as the object (or imager) is translated. The multiple line-images are then assembled line-by-line to form a complete image, as indicated below. A scanning system is often needed to use a Resonon imaging spectrometer.
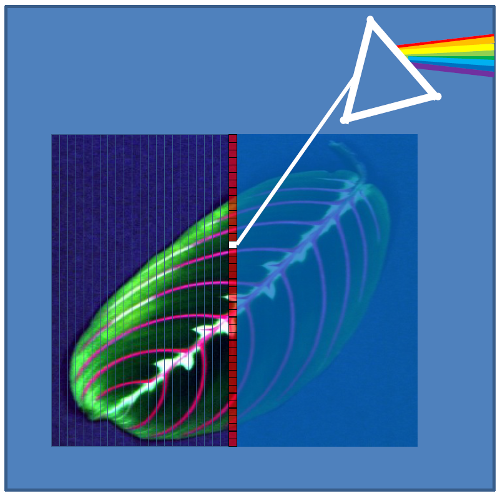
To obtain hyperspectral data, the signal from each pixel is dispersed (or diffracted) into its spectral components, much like passing the light from each pixel through a prism. This process occurs for every pixel in the line (red squares in the image below). The dispersed signals from all the pixels are imaged onto a focal plane array. One of the benefits of this approach is that all the spectral (color) information is collected at the same time for each pixel. The result is a detailed spectral curve for every pixel in the image.