9. Advanced Data Analysis 3: Hyperspectral Vegetation Indices
9.1. Introduction
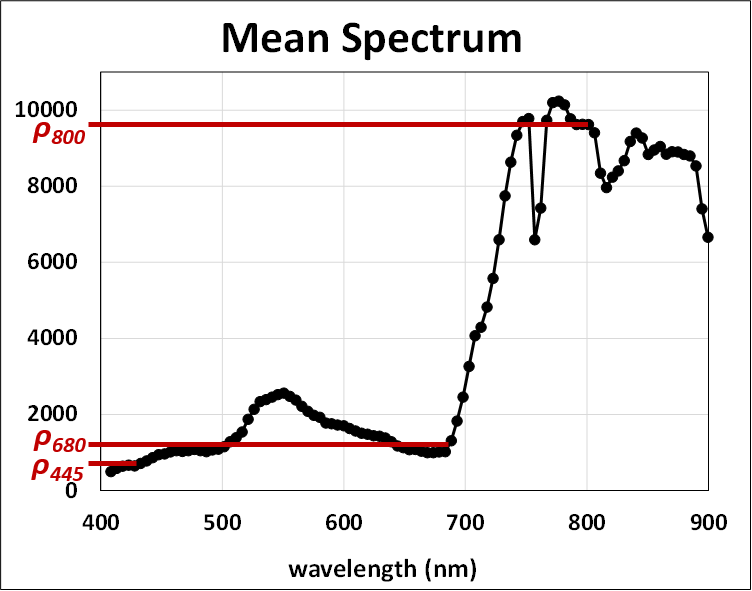
Hyperspectral Vegetation Indices (HVI’s) are a common tool for analyzing hyperspectral data of agricultural crops. They are typically simple arithmetic combinations of sums and differences of spectral reflectance values at particular wavelengths. For example, the Structure Insensitive Pigment Index (SIPI) is defined by the following expression:
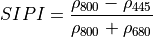
where the values  ,
,  , and
, and  are shown graphically in the figure below:
HVI’s have found many applications in research using airborne remote sensing data, and are currently subjects of intense research efforts.
9.1.1. Useful References
The developers at ENVI have written an excellent description of HVI’s, which is available at their website. We at Resonon consider ENVI (owned by Harris Corporation) to be excellent hyperspectral data analysis software. Here is a link to their HVI website:
http://www.harrisgeospatial.com/docs/VegetationAnalysis.html
Another very good reference discussing HVI’s is this book:
Thenkabail, Lyon, and Hute, Remote Sensing of Vegetation, CRC Press (2011).
9.1.2. HVI’s in Spectronon
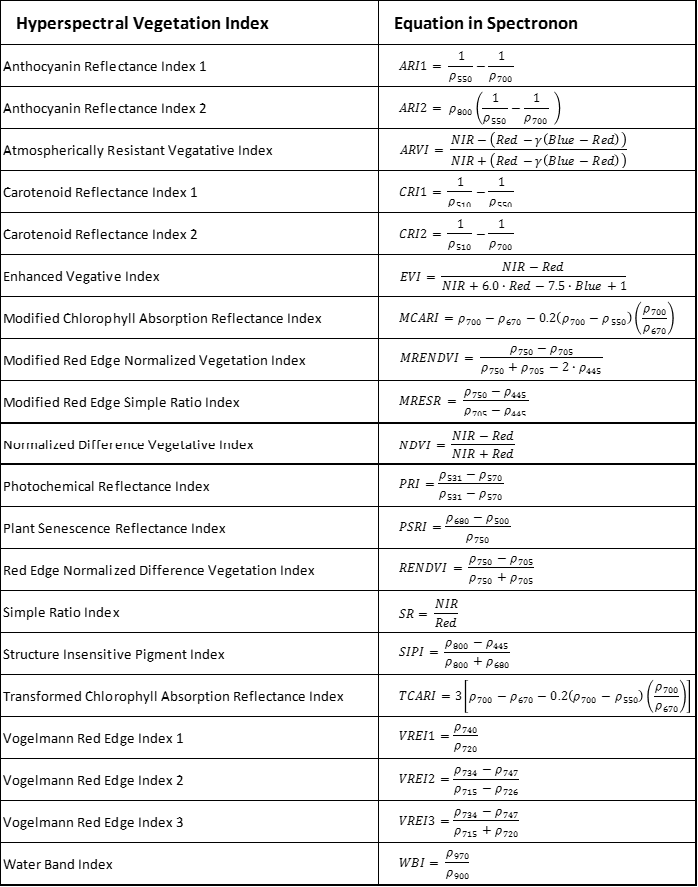
HVI’s calculated by Spectronon are listed in the following table. Also listed are the equations that Spectronon uses for each HVI.
9.2. Generating HVI maps in Spectronon
The datacube in the following example was acquired using a Resonon airborne hyperspectral imaging system. This datacube is available for free download from http://downloads.resonon.com/.
HVI’s in Spectronon can be found at the path: Datacube  New Cube
Agriculture:
New Cube
Agriculture:
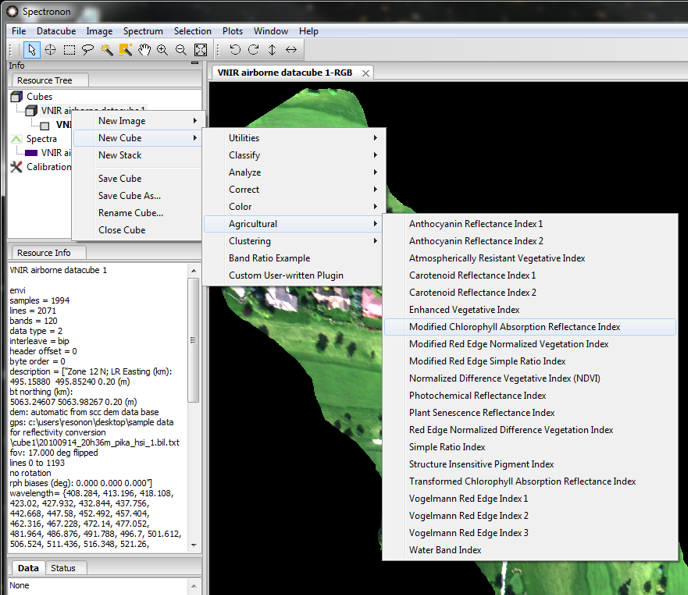
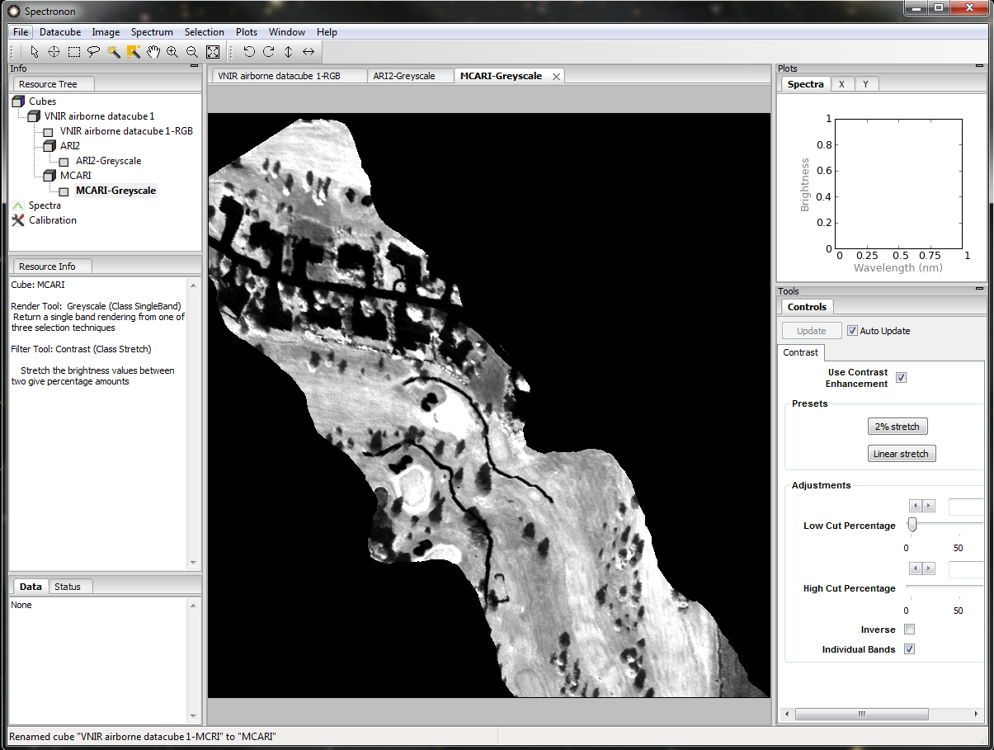
Choosing an HVI from this menu will generate a grey-scale image:
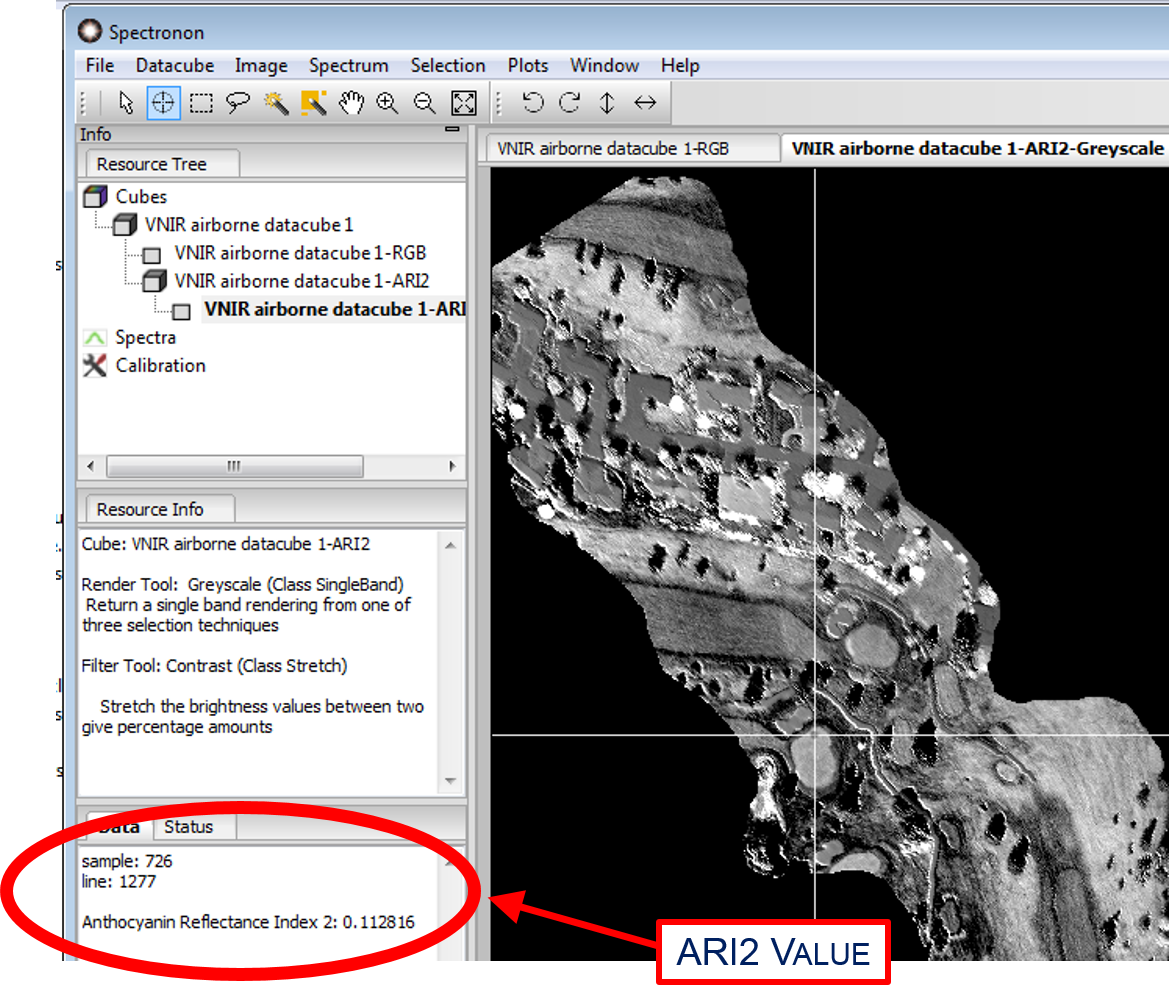
The value of the HVI at any pixel can be obtained with the Inspector Tool  :
:

The value of the HVI, along with the coordinates of the inspector tool, can be found in the lower left corner of the screen:
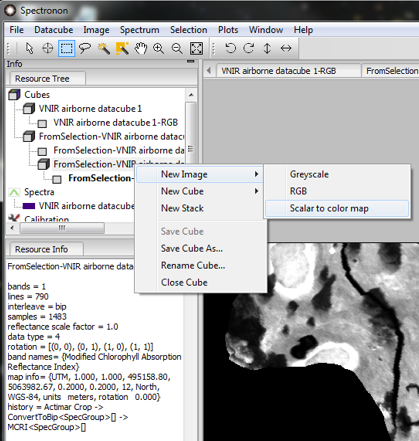
Another tool for visualizing HVI maps is to transform the grey-scale image into a colormap. This can be accomplished
with Datacube New Image Scalar to Colormap:
Below is a “spectral” colormap of the MCARI index for the example datacube:
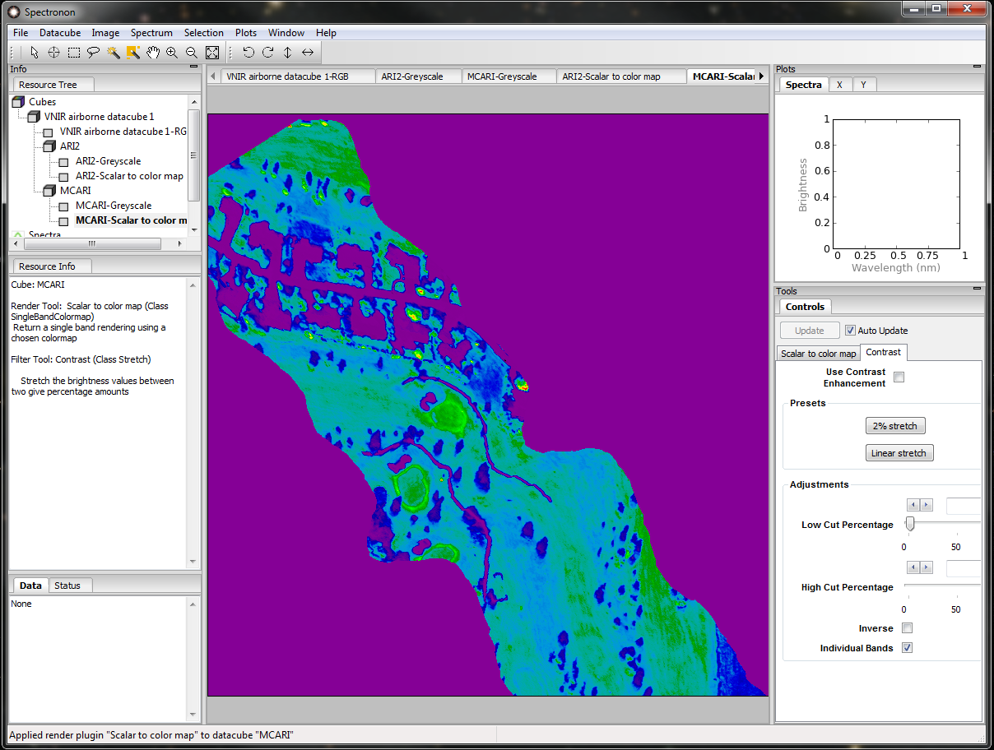
After generating a colormap, the user can change the color scheme from the Colormap menu on the Controls tab. It may be helpful to toggle the Contrast Enhancement feature. Experiment with different colormaps, normalization, and contrast settings, all available on the Controls tab.
Note: If an HVI is selected that requires spectral bands that do not exist in your datacube, the warning shown below will appear. As described in the warning, clicking “OK” will generate an image using the closest bands available, but the resulting image will often be a poor approximation to a true index mapping.